Your Shopping Cart is empty.


Download sample
File Details
Published: 2025-01-28 00:05:59.807458 Category: Technology Type: Photo Model release: No
Share
       

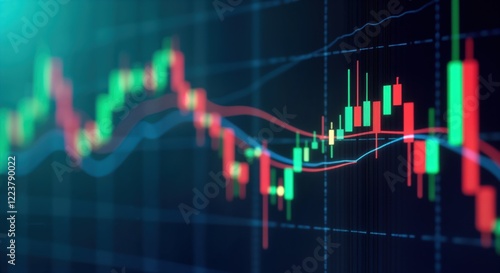
Tech chart shows market volatility. Red, green candlestick chart on blue screen. Up, down trends visible. Stock trading crypto currency data displayed. Financial data analysis on screen. Dax

Contributor: Pete
ID : 1223790022

TitleFilesize
Photo5632x3072


Buy on Adobe Stock

Keywords
chart, candleholder, graph, market, volatility, trend, stock, trading, crypto, currency, dax, financial, datum, analysis, price, indicator, investment, technology, finance, business, screen, blue, red, green, technical, indicator, investing, strategy, stock, option, future, forex, invest, volume, momentum, support, resistance, swing, pattern, visualisation, action, platform, system, software, online, exchange, investor